NEW Reporting Feature
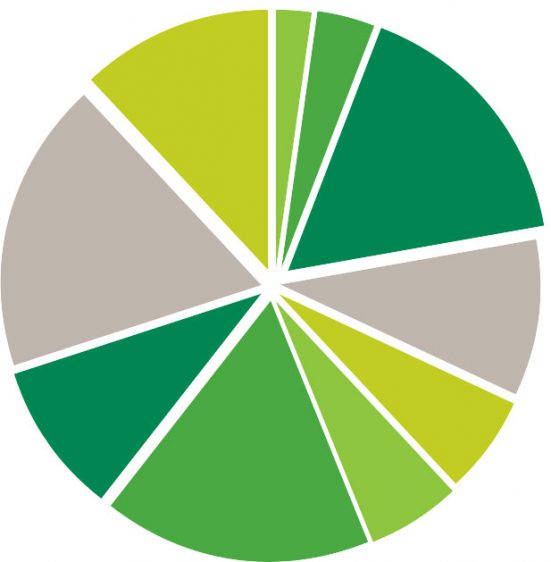
We have developed a few new exciting reporting features into the reports/dashboard within SalesPresenter, giving you the ability to create pie charts and bar charts of top 10s and generate sales leaderboards. *
Top 10 Products by Quantity/Value Sold
- By catalogue or family codes.
- Using a pie chart or bar chart.
- In the bar chart, compare this year to last year**
- Display in a landscape or portrait document.
- Email the report directly from SalesPresenter.
- Print reports directly from SalesPresenter.
- Include all of your products to understand as a percentage of sales, how much is just your top ten.

Sales Rep Leaderboard
- Generate a leaderboard at any time to visualise your top salespeople.
- Utilise your location function to see who is doing the best at a trade show.
- Base your report on Orders, Quotes, Invoices and Credit Notes.
- Email the reports out directly from SalesPresenter.
- Print the report directly from SalesPresenter.

YouTube video coming soon but in the meantime easily access this feature by following these simple steps below:
- 1. Log in as a rep on the home screen
- 2. Click reports/dashboards
-
3. See bottom 3 additional reports named:
Top 10 products by quantity sold
Top 10 products by value sold
Sales rep leaderboard
*requires IOS 10 or above.
**this will require ‘sales year to date’ and ‘sales last year’ fields populated against product records.
